This page includes the procedures, practices and formulas followed when performing the axial loads for the Resurgence. It also features a downloadable Excel file that was used to calculate the load across the length of the rocket. The goal is to get an idea about the level of axial loads and stresses in the worst-case scenario, which entails making assumptions and deriving results from other simulation software. The analysis will be compared with design specifications and compressive tests results to determine the rocket condition for flight.
Time Snapshot
The worst-case scenario typically occurs when the rocket is under maximum dynamic pressure -at Qmax– which happens theoretically at motor burnout, [1]. That is, when the rocket achieves highest airspeed and maximum Mach number. At that instant, all propellent is exhausted and no more thrust is generated, but drag forces are at a maximum.
Drag Forces
Drag forces take the greater chunk of work in the ensuing analysis. One technical paper served as the basis for all drag coefficient calculations.


Drag types considered:
- Skin
- Fin skin
- Base
- Fin base
- Wave drag
- Parasite
Other analysis approaches would consider rocket components as local drag contributors and treat each component contribution to the overall drag separately. This method is not followed here as the above equation cover all drag sources efficiently in their general forms.
Axial Loads Formulas
[1] provides the following equations to calculate the axial loads at a vehicle’s station (x):
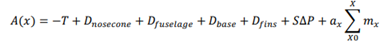
Where ax is acceleration, and mx is the mass of body station (x).
At Qmax thrust is zero.
Flight Parameters
| Flight Parameter | Value | Unit |
| Maximum Flight Speed (V) | 499 | m/s |
| Mach Number (M) at sea level | 1.45 | |
| Gust Wind (U) | 25 | m/s |
| q | ||
| 3.504 | ||
| 5.637 | ||
| -0.5893 | ||
| Reference Area () | 0.01705 | |
| Fuselage Density | 1850 | Kg/m3 |
| Fuselage Surface Area | 0.965 | m2 |
| Nose Surface Area | 0.1708 | m2 |
| Moment of Inertia | 27.66326 | |
| Cg from rocket aft | 1.21 | m |
| Total Mass Without Propellent | 34.65 | kg |
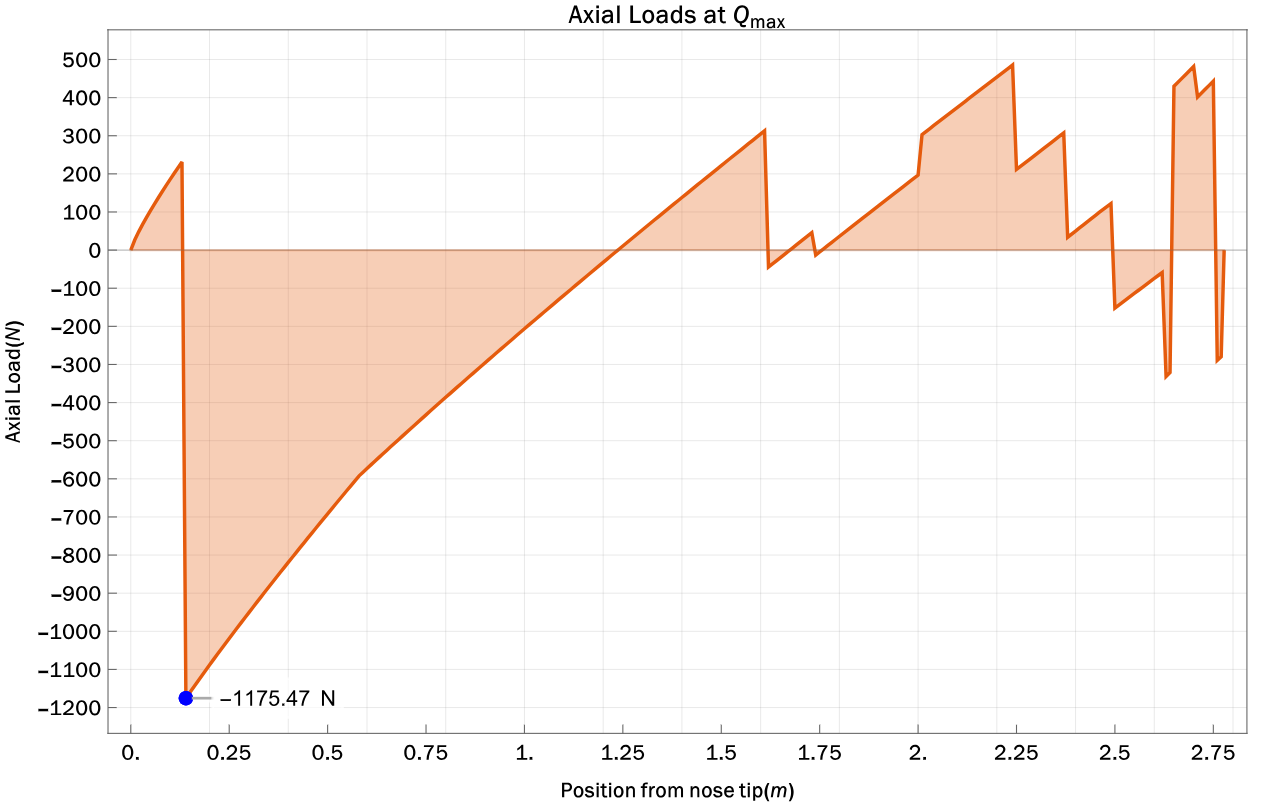
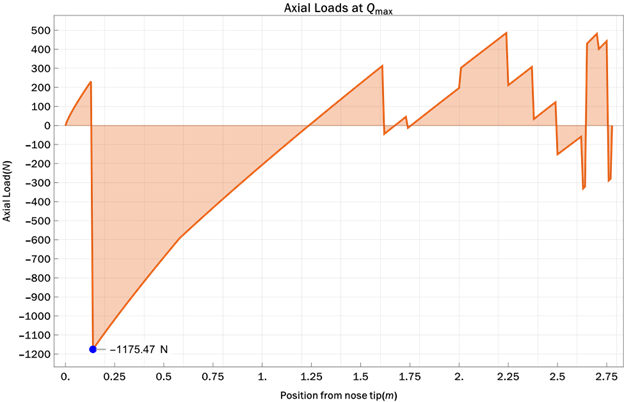
Results
Check Figure 1.
Remarks
The highest load acts on the nose cone which has the smallest cross-sectional area. At that point -roughly 14 cm below the nose tip-, the stress:

Leave a Reply